
GUNNISON PROJECT
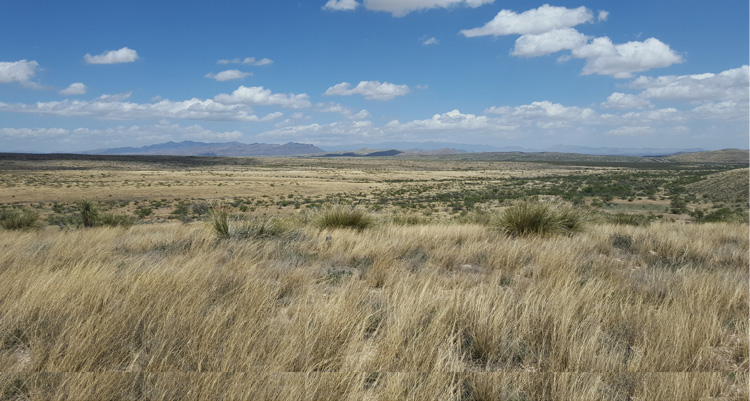
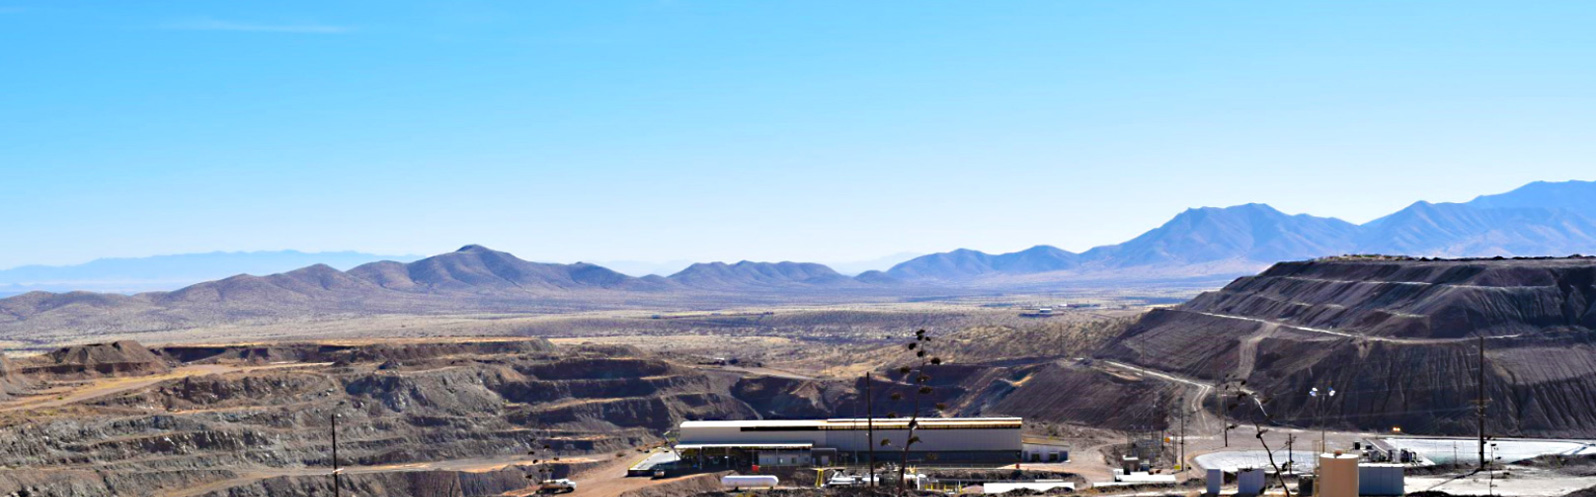
The Gunnison Project is located about 65 miles east of Tucson, Arizona on the southeastern flank of the Little Dragoon Mountains in the Cochise Mining District. The property is within the copper porphyry belt of Arizona.
The Gunnison Project hosts the Gunnison deposit and contains copper oxide and sulfide mineralization in potentially economic concentrations.
The PEA outlines an open pit heap leach and SX/EW operation extending over 21 years and producing LME Grade A copper cathodes directly onsite.
PROJECT HIGHLIGHTS
- Private and State land package and 100% ownership in Tier 1 jurisdiction
- Onsite power, rail and water in place
- Simple open pit heap-leach and SXEW operation
- Permitting framework is simple and streamlined with the State
NEXT STEPS
- Metallurgy and infill drilling
- Pre-Feasibility Study
- Definitive Feasibility Study
- Construction Decision
Highlights of the PEA (United States dollars)
- The Gunnison Project, a fully vertically integrated operation producing finished copper cathode on-site in Arizona for domestic U.S. supply chains, has an after-tax net present value (8%) of ~$2 billion and an internal rate of return (IRR) of 22.5% at a long-term copper price of $4.60/lb
- One of the most substantial open pit copper projects in the United States. The straightforward mine plan consists primarily of oxide copper mineralized material with a life of mine total processed of 541 million tons at 0.43% total copper grade, including 25 million tons at 0.85% total copper grade from the Strong & Harris satellite deposit
- Simplified and lower risk path to permitting; the Gunnison Project has current operating permits and there is a more streamlined amendment process to State and Local permits to proceed with open pit mining
- Significant economic impact to Cochise County, State of Arizona, and the United States nationally through creation of over 112,744 job years, $558 million in state and local county taxes, $1.43 billion in federal taxes, and $21.9 billion in total economic output
- Average annual copper cathode production of 174 million pounds (“lbs”) (87 thousand tons) for the first 15 years; enough to potentially supply over 11% of the current United States domestic refined copper metal production from mineralized material1. Total copper produced 3.2 billion lbs over a 21 year mine life
- Cash costs of $1.70, Sustaining Cash Costs of $2.00, and All-In Sustaining Cash Costs of $2.05 per pound of copper produced are in the lower half of the cost curve for copper mines globally
Environmental advantages include lower water usage per pound of copper produced versus copper concentrate producers, up to 10% reduced energy consumption due to on-site clean energy production, and zero risk of environmental impacts from tailings dam failures as there are no tailings produced.
The PEA is preliminary in nature and includes inferred mineral resources that are considered too speculative geologically to have the economic considerations applied to them that would enable them to be categorized as mineral reserves. There is no certainty that the conclusions reached in the PEA will be realized. Mineral resources that are not mineral reserves do not have demonstrated economic viability.
TABLE OF KEY METRICS
Key Valuation Metrics at $4.60/lb Copper Price Base Case
| Copper Price Assumptions | $4.60/lb Cu Consensus | $5.75/lb Cu SPOT | |
| Net Present Value @ 8% (after-tax) | $M | 1,959 | 3,227 |
| Internal Rate of Return (after-tax) | % | 22.5% | 31.8% |
| Payback Period | # years | 3.9 | 2.6 |
| Av Annual Free Cash Flow (Y1-Y15) | $M | 366 | 514 |
Notes:
1. Non-IFRS financial measure; see “Non-IFRS Financial Measures”.
Key Project Metrics
| Project Metrics | Unit | 2026 PEA |
| Construction Period | # months | 24 |
| Life of Mine | # years | 21 |
| Strip Ratio | Waste : Feed | 2.56 |
| Mineralized Material Mined | millions tons | 641 |
| Limestone Mined | millions tons | 133 |
| Alluvium-Gravel waste | millions tons | 1,007 |
| Hard-Rock waste | millions tons | 501 |
| Copper Grade placed on Heap | % CuT | 0.43% |
| Average Annual Crusher Throughput (Max) | millions tons | 40 |
| Recoveries | % CuT | 68% |
| Oxide / Enriched Recoveries | % CuTSol | 90.2% |
| Primary Sulfide Recoveries (years 10 to 21) | % CuSu | 59.9% |
| Recovered Copper Cathode | millions lbs | 3,187 |
| Average Annual Copper Production (years 1-15) | millions lbs | 174 |
| Initial Capital (including contingency) | $ millions | 1,556 |
| Initial Capital Excluding Acid Plant | $ millions | 1,273 |
| Capital Intensity1 | $/ton Cu Capacity | 17,609 |
| Capital Intensity Excluding Acid Plant | $/ton Cu Capacity | 14,411 |
| Profitability Ratio | $/ton Cu Capacity | 1.26 |
| Expansion Capital (including contingency) | $ millions | 682 |
| Sustaining Capital2 | $ millions | 587 |
| Cash Cost (C1)3 | $/lb Cu | 1.70 |
| Sustaining Cash Cost4 | $/lb Cu | 2.00 |
| All-In Sustaining Cash Cost5 | $/lb Cu | 2.05 |
Notes:
1.Capital intensities are calculated as initial capital, divided by maximum annual copper cathode plant capacity of 88.3 Ktons. Expansion capital is expenditures to either build new facilities, for example the cement plant built in years 4-5, or to expand the capacity of initial facilities, for example increased capacity of leach pad
2. Sustaining Capital are expenditures to maintain initial facilities. Includes $186 million in deferred stripping costs. Includes sustaining capital for both the copper plant and the cement plant
3. Cash Cost includes mine operating, crushing and leaching, process plant operating, and general and administrative costs ("G&A")
4. Sustaining Cost includes Cash Cost, Sustaining Capex, Deferred Stripping, and Royalties
5. All-In Sustaining Cost (AISC) includes Sustaining Cost, Property Taxes, Severance Taxes, and Closure Costs. It excludes expansion and initial capital, and income taxes
The Technical Report was prepared under the supervision of John Woodson, PE, SME-RM, of M3 Engineering & Technology Corporation, Tucson, Arizona, who is a Qualified Person that is independent of the Company. For additional information on the Gunnison Project please refer to the technical report titled “Gunnison Project NI 43-101 Technical Report, Preliminary Economic Assessment, Cochise County, Arizona, USA” with an effective date of March 18, 2026 filed on SEDAR+ at www.sedarplus.ca.
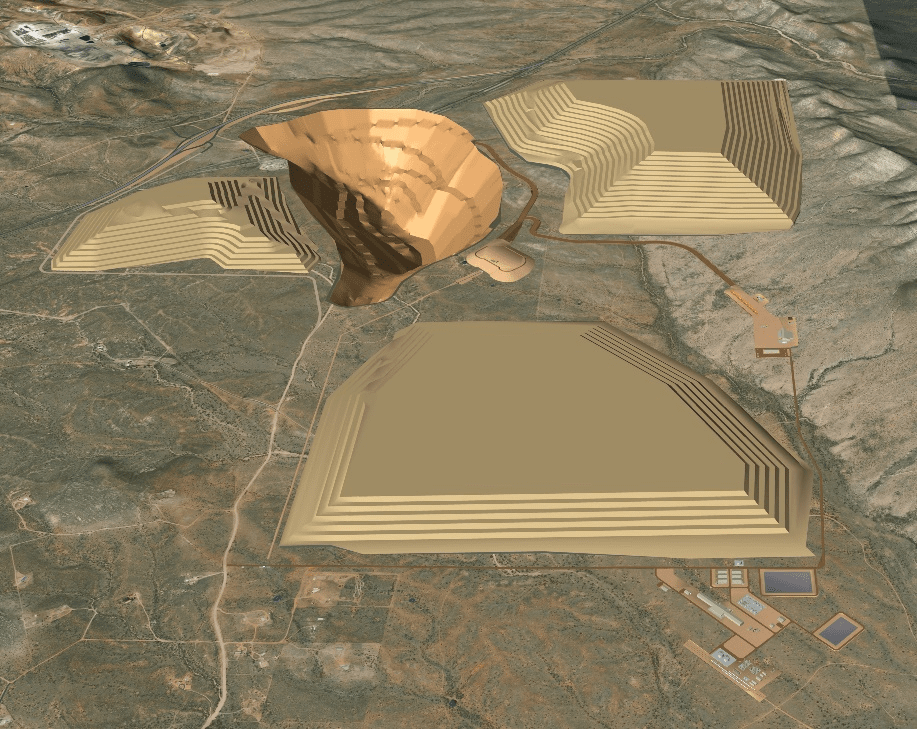
3D View of Gunnison Project Infrastructure